Director’s note: The Immigration and Nationality Act of 1965 was a turning point in U.S. demographics. The act eliminated restrictions on national origin and instead established a general quota on all immigrants. The new system ignored concerns of ethnic compatibility (deemed “racist” in the prevailing cultural revolution of the 60s) and instead simply prioritized family reunification, employment, and refugee status. Prior to its passage, the US limited immigration to those that were able to assimilate culturally—or, as the Naturalization Act of 1790 put it, “white persons good character.” Naturalization was later expanded to African persons in 1870 but no others and immigration from Africa remained restricted. Before 1965, immigration legislation weighed the influence of immigration law with the ethnic homogeneity of the country. The 1965 Act was a dramatic departure from this practice.
What happened? A small cadre of politically active elites engaged in a mass marketing campaign to convince the public that the act would not alter the ethnic mix of the United States; but if it did, the US was always a “nation of immigrants” so there’s nothing to worry about.

Prior to 1964, very few people believed America was a “nation of immigrants.” The phrase was only popularized by John F. Kennedy’s essay, “Nation of Immigrants,” posthumously published that year after being commissioned by the Anti-Defamation League of B’nai Brith (now known as the ADL).
A year later, while the country was still chewing on this new concept, JFK’s younger brother, Edward Kennedy, then the Chairman of the Senate subcommittee hearings on the 1965 Immigration and Nationality Act promised in his opening remarks:
Under the proposed bill, the present level of immigration remains substantially the same . . . Secondly, the ethnic mix of this country will not be upset . . . Contrary to the charges in some quarters, S. 500 will not inundate America with immigrants from any one country or area, or the most populated and economically deprived nations of Africa and Asia . . . In the final analysis, the ethnic pattern of immigration under the proposed measure is not expected to change as sharply as critics seem to think. [Lawrence Auster, The Path to National Suicide: An Essay on Immigration and Multiculturalism, page 11 1990, Monterey, Virginia, The Immigration Control Foundation]
Nothing could be further from the truth. Prior to 1965, the ethnic mix of the U.S. was 84% non-Hispanic White. As of the 2020 census, the U.S. is only 54.84% non-Hispanic White.
It could be argued that the 1965 Immigration and Nationality act ought to be repealed on the grounds that it passed via deliberate deception. However, to do this, we should establish that the demographic decline is in fact a result of the act itself and control for other variables such as the birth rates of other ethnic groups already within our borders and other modern trends. With the help of AI, we do this below.
Finally, for clarity, in our analysis, wherever we refer to Whites, we mean non-Hispanic Whites.
The Once and Future America: What if the 1965 Revolution Failed? Can We Undo it?
The past 60 years of American history have been defined by social and economic developments that almost all spring from the passage of the Immigration and Nationality Act of 1965, also known as the Hart-Celler Act. This piece of legislation, opposed by normal Americans and a great many of our most patriotic institutions resulted in the rapid demographic transformation of our society. America’s foreign-born population was just 4.7% of the total population in 1970. As of 2025 the foreign-born population has reached a historic peak high of 16% of the total population. This is 51 million people.
American cities have seen their founding White populations replaced by consecutive waves of Hispanic, Asian, and African immigrants while Black neighborhoods in California, New York City, Texas and Georgia have been transformed into outposts of Mexico, Vietnam, or the Dominican Republic. Along our Southern border, centuries-old communities of Hispanic Americans in Texas (Tejanos), California (Californios), and New Mexico (Hispanos) have been made politically and socially irrelevant thanks to a near-constant flow of Mexican and Central American immigration. American children compete with the many millions of second-generation immigrants for school resources and coveted college admissions, American families compete with immigrants for scarce and increasingly expensive housing, and American men and women compete with a near ceaseless tide of immigrants for jobs and career opportunities. Thousands of Americans die every year at the hands of foreign-born criminals. Hundreds of billions in American tax dollars are funneled to immigrants in the form of welfare benefits to legal and illegal foreigners alike.
We should be clear: We do not blame individual immigrants for this state of affairs. A dedicated elite political class created the policy environment that allows for it. American elites passed the Hart-Celler Act, American elites passed the 1986 Reagan Amnesty, American elites have enabled the abuse of our welfare state and they have allowed tens of millions of illegal immigrants to pour over our Southern border for decades. The people who promote these policies live in gated communities far from the consequences of their actions, send their children to private or charter schools, and have the connections to ensure their children will always find work.
In short, they sold the nation out for cheap labor for their corporate donors, cheap nannies for their career obsessed wives, and cheap gardeners to maintain their lavish suburban yards. Every negative externality of their new gilded age lifestyle and record corporate profit margins has been hoisted upon the shoulders of the average American.

Still, it did not have to be this way. Our congressmen could have listened to patriotic warnings of The Daughters of the American Revolution, the American Legion, the American Coalition of Patriotic Societies, The Baltimore Anti-Communist League, the American Farm Bureau Federation, the National Council of Agriculture, and numerous other organizations which fought against the passage of the Hart-Celler Act in whole or in part. Many of these groups testified before Congress, others led public campaigns against the passage of the legislation.
This raises the very question this article seeks to answer: What if the 1965 Immigration Act (Hart-Celler) and the 1986 Reagan Amnesty had never passed? What if mass illegal immigration had never occurred? What would our country then look like today?
We crunched the numbers (with the help of Grok) and found that America would still look different compared to our demographics from 1965 as it does in our current timeline. However, we also found that the country would, demographically, be fundamentally the same as it has always been. America would have been recognizable to most of the men and women who helped build it.
In 1965 the demographic makeup of the American population was roughly:
- 84% Non-Hispanic White (161.75 million people)
- 11% African American (20.5 million people)
- 4% Hispanic American (8.1 million people)
- 1% Asian American (1.32 million people)
- And < 1% Native American (1.1 million people)
The national population in 1965 was 193,419,000 people with a foreign-born share of less than 5%. In short, our population was composed of settled communities with minority communities concentrated in distinct regions. Most Hispanic Americans were concentrated in Southern California, New Mexico, and along the Texas-Mexico border. Roughly 53% of African Americans lived in the South in 1965 and most of the remainder of the African American population was spread out piecemeal in large Northern cities such as Detroit, Gary Indiana, Chicago, and Philadelphia. White Americans dominated virtually every other space in the country. 23 states had a White majority of 90% or greater, and a further 9 states possessed a White majority of 84% or greater – 84% being the national average share of the White population at the time.
Virtually the entire African American and Hispanic American populations could trace their roots to ancestors who had been present in the modern geographic area of United States since the 19th century. Nearly all White Americans had ancestors who arrived before 1920, and more than half of White Americans had ancestors present in the country by the end of the Civil War (according to Grok). These facts make it worth repeating that by 1965, America was a nation with a 95% native-born population composed of settled communities that had been present on this continent for several centuries.
When Congress passed the Hart-Celler Act, America was not a nation of immigrants. America was not ‘diverse’ in the modern sense. And America was certainly not a multicultural society.
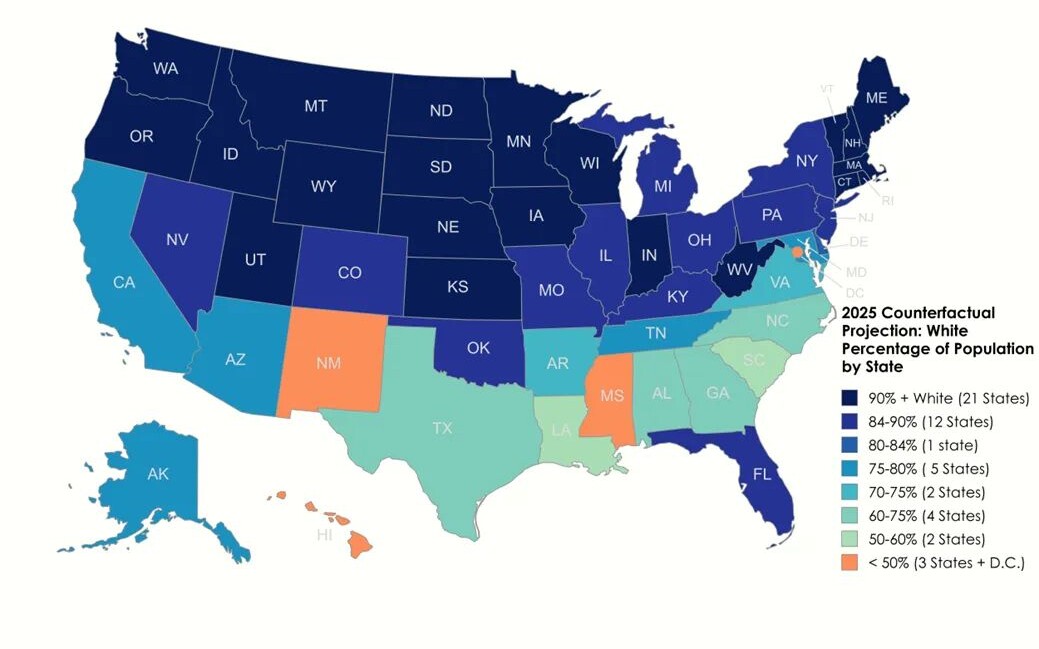
Had the Hart-Celler Act and 1986 Reagan Amnesty not been passed, our counterfactual data crunching shows that American demographics would have looked like this by 2025 (as compared to the 2025 actual data):

What drew our eye first in the counterfactual data is what remains the same: The African American population retains a near-identical share of the population, despite a decrease in raw numbers of some 8 million individuals. This decrease comes almost entirely from the fact that post-1965 immigration of non-African American Blacks would never have occurred. In the present day, the foreign-born and second generation population of Black immigrants constitute 21% of the Black population of the United States. This share is only growing and has pushed African American communities out of several communities in New York and Minneapolis. Some states, such as South Dakota and New York, have Black populations that are 32% or more immigrant derived. Our model eliminates the lion’s share of that demographic.
The (non-Hispanic) native American population also remains remarkably similar, constituted of single-race native Americans and pre-2020 census mixed-native Americans. We moved the 2020 census “Pretendian” population of mixed natives to the proper White demographic category (where the likes of Elizabeth Warren and company belong).
This brings us to White Americans who, in our demographic counterfactual, retain a much larger share of the population than in current times—74% in the counterfactual compared to the 57% share Whites hold in the actual 2025 data. Some nationalists will doubtless feel this is ‘too low’ given the historic averages, but we would like our readers to consider several key points:
The first is that in our counterfactual model virtually the entire population is descended from the same stock that was present in the country in 1965. This means that, absent massive state intervention to prevent it, the population would have developed along many of the same modern trends that it did in actuality. For this reason, our demographic model takes into account trends in birth rates, abortion, mixed-families, and several other demographic trends as they actually developed. So while the White share of the population still declined, virtually the entire American population descends from a settled pre-1965 set of communities.
The second is that the foreign-born population in our model is remarkably low—just 2.3%. With no changes to the immigration system in the counterfactual post-1965 era, our model assumes roughly 100,000 Europeans continue to arrive each year plus small numbers from Canada, Latin America and Asia. Including modern marriage trends (some Americans finding love abroad) we concluded that the foreign-born population would be roughly 6 million individuals with 80% originating from Europe and 20% Latin America, Canada, and Asia.
The third consideration is geographic concentration. Unlike in the modern era where White demographics have imploded in nearly every state in the union the counterfactual model produces data showing that White demographic decline is limited to just a few states. These are states where settled communities of minorities existed long before 1965. Further, assumed very marginal internal migration of these populations given how concentrated modern American economic development has been in the states they reside in such as Texas, California, and the American South.
Many states fair far better in our counterfactual than in modern times. Today there are 9 states with a majority-minority population: Hawaii, California, Nevada, New Mexico, Texas, Florida, Maryland, New York, and New Jersey.
In our counterfactual, only three states, Hawaii, Mississippi and New Mexico, have majority-minority populations. Hawaii has never had a White majority and New Mexico’s White population has been in steady decline since 1910.
D.C. also retains its majority-minority population in our counterfactual.
California’s White demographic decline in the actual data shows a White population collapse from 83% in 1965 to 34.7% today, with California having an overall population of 39.4 million. Our counterfactual shows a decline from 83% in 1965 to 78% by 2025 and an overall population of 28 million people. Without mass immigration driving up housing costs, internal migration to California would likely have remained very high and White Americans would have retained a robust majority.
Texas likewise retains its White majority. In the actual data, the modern Texas has a White population of just 37% of an overall population of 31.3 million. In our counterfactual, Texas’ historic White majority retains a 62% share in a population of 22 million. This is only an 8-point decline from the 70% White share in 1965.
Perhaps the most staggering change is Florida. Modern Florida has a majority-minority population with Whites constituting 49% of the population of 23.4 million people. In our counterfactual Whites retained an 84% share of a Florida whose overall population is about 12.5 million. No more traffic in the sunshine state!
In the actual 2025, just two states, Maine and Vermont, have White populations in excess of 90% (there were 23 such states in 1965) while in our counterfactual model 21 states retain a White majority of 90% or more. A further 12 states in our counterfactual retain a White population in excess of 84% – 84% being the White population share of the country in 1965.

In an America that never saw the post-1965 immigration reforms 34 states would have a White population exceeding 80% and 134.5 million White Americans (70% of the White population) would live in one of these states. In the actual 2025 only 6 million White Americans (3% of the White population) live in a state that is 80% or more White.
What we can clearly show with the counterfactual data is that even without the 1965 revolution, America would have changed; but it would still have been populated by Americans. Modern post-sexual revolution trends in marriage (or lack thereof), abortion, intermarriage, and a general decline in the number of children per woman would have resulted in some inevitable demographic changes. African and Hispanic Americans, who maintained higher fertility rates for much longer than White Americans, would have increased their share of the nation’s demographic pie, but only very modestly.
Had we never engaged in the post-1965 immigration experiment, most of the United States would look the same today as it always had—a core European majority population that defined national character and institutions, with occasional regional and urban minorities making their own unique cultural contributions to the country.
This data inevitably leads us to the next question: can anything be done to get the nation back on track? Our readers should not be surprised to learn we believe the answer is an emphatic yes!
In our landmark piece The American Reparation Policy Platform (ARPP), we put forward a set of comprehensive remigration and deportation policies aimed at reducing the population of post-1965 immigrants and their descendants. The goal of these policies is to achieve a modest demographic correction through humane, compassionate, and cooperative policy making with both individuals and other countries. Through a combination of mandatory repatriation policies (MRPs) and voluntary repatriation policies (VRPs) we showed that we could largely correct the demographic course of the nation.
If implemented, the policies outlined in the ARPP would result in a nation that was roughly 75.5% White and 24.5% minority. These shares are nearly identical to the population mix we would have had today if the 1965 immigration revolution had never happened.
Remigration is about first deporting the criminal, fraudster, welfare cheat, and the illegal immigrant. Second, it’s about establishing a set of policies to help the tens of millions of immigrants and their descendants who want to leave to do so. None of these proposals are violent or coercive.
America needs remigration if we are to correct our demographic course. We can bring much of the America we once had into our future if we only try.