Director’s Note:
At White Papers, our core premise is that Western peoples deserve our own voice, our own political institutions, and a future free from interference from outside groups. However, demographics is destiny and the dramatic increase in non-Western immigration is threatening the native populations of the US, the UK, The Netherlands, Ireland, Norway, Belgium, Sweden, Germany, Austria, France, and more.
An immigration moratorium coupled with practical, humane policies of repatriation and remigration is the key to reversing our demographic decline and restoring self-determination for our countries. However, the most common argument against limiting or reversing immigration is that “immigrants are good for the economy.”
Social services are struggling, but not for the reason immigration enthusiasts think they are. Alden Whitfeld from Heretical Insights offers a direct, no-apologies economic analysis of the net tax contribution by demographic group here.
It’s easy for White people in particular to be squeamish when discussing demographic change. We’ve been led to believe disparities only exist due to White “racism” despite many years of immense effort to offer special opportunities such as affirmative action to non-Westerners. Whites have been subjected to a massive PR campaign to pass the 1965 Immigration Act and Civil Rights legislation to believe that disparities exist only because of white “racism,” and probably that nonwhites are more noble and hard-working than we are.
But economies don’t run on propaganda. At some point or another, our countries will collapse if immigration and demographic trends continue.
The question of just how much of a strength is racial diversity is one that has spurred many scholarly debates, with brilliant thinkers from both sides proposing some excellent points. On one hand, some have argued that it brings crime, reduces trust, and is the source of endless conflict and resentment. On the other hand, others have pointed out that, hey, at least the food is pretty good. When I first set out on the mission to finally put a price tag on racial diversity, HBD blogger Ryan Faulk’s “Fiscal Impact by Race in 2018” was the most obvious source of inspiration. His work has already been used by other talented autodidacts, such as C. Kyle, who used a similar method to estimate how much African Americans owed in reparations to the country. I tried to replicate Ryan’s methodology for 2022 before ending up having to revise my estimates two more times afterwards (thanks Excel). But while I was at it, I also found a way to improve upon his method, so let’s get on with it.
CONTENTS
Direct Net Effect
The net effect of each race is calculated as the difference between their tax revenue and government usage for that year. For government usage, this is divided into “variable government assignment” and “equal government assignment”. Variable government assignment refers to services that differ in their per capita rate of consumption between races, while equal government assignment are the remaining services which are assumed to be used equally between races on a per capita basis. For variable government assignment, these are the racial distributions:1

“Services” don’t refer only to government programs intended to redistribute wealth, but rather everything that costs the government money. The reality is that if some racial groups are more crime-ridden, then the expenses the government incurs from having to spend more on law enforcement is part of the cost attributable to that group. So, converting these percentages to absolute terms, we get this:

The rest of government spending for that year fell under equal government assignment. Adding the two together, we get the total government usage for that year by racial group:

Well, that covers the government usage side. Now it’s time to take a look at tax revenue. For revenue, rather than interpolate the income brackets of the races in order to guesstimate their share at each percentile like Ryan had done, the exact values can be derived off IPUMS USA using the race, Hispanic origin, and household income variables. Doing so, we get this:

To estimate the amount of taxes paid, the Institute on Taxation and Economic Policy releases reports that calculate the percentage of tax revenue from each income bracket every couple of years. Ryan got lucky because they had one for 2018, but there isn’t one for 2022. There are ones for 2020 and 2024, however, so the average of the two years were used to produce the hypothetical tax contributions by income bracket for 2022. This shouldn’t matter much considering none of the values differ by more than 1%, but here it is nonetheless:

Great! Now we can calculate the total tax revenue for each race. Here are the results:

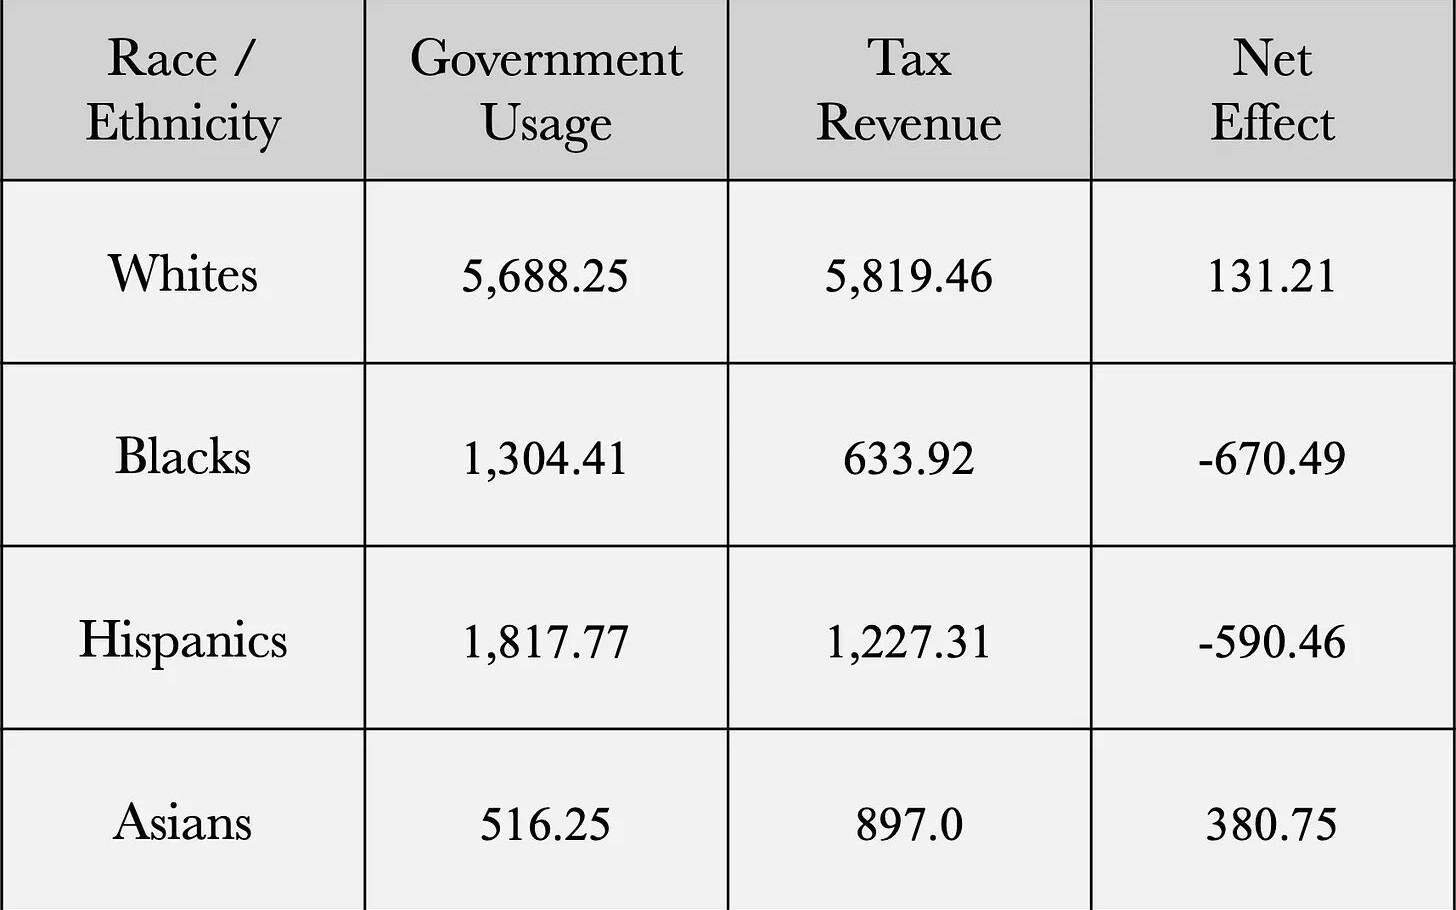
And so finally, without further ado, here is the final estimate for the direct net effect of the four main racial groups in the United States for the year 2022:

It is not at all clear that modern immigration has been a success story in the United States; Hispanics contribute over half a trillion dollars to the budget deficit, which is more than the direct fiscal gain from having Asians in the country. Moreover, the cost of crime here was calculated from simply weighing the racial usage of law courts, police, and prisons, but this is, in reality, an underestimate because the true cost of crime is much more than what the government spends on these services, so blacks and Hispanics are an even bigger drain than they look.
Getting a Full Picture
Speaking of crime, the question of immigration and crime has almost always been treated as strictly a compositional effect (i.e., group A has a crime rate of X and group B has a crime rate of Y. If a community which was 100% comprised of members of group A becomes 25% comprised of members of group B instead, how does this change the average crime rate in that area using the rates for the two groups?). Every once in a while, the discussion extends to the rates of offending for the descendants of immigrants. However, it’s possible that migrants actually elevate the native crime rate, though this point is speculative. There is suggestive evidence that marriage/cohabitation causally reduces crime from within-individual studies across multiple European countries (see Kirkegaard, 2025). Additionally, there is also suggestive evidence that racial diversity reduces both marriage and fertility within countries in the long run, probably because people don’t want to pair up with those too dissimilar to themselves (see Kirkegaard, 2024). Indeed, a recent 2024 study funded by the U.S. Census Bureau found that, looking at blacks and whites, increased racial exposure to opposite-sex members of the other race did not have any effect on the likelihood of interracial marriage, much to the dismay of its authors (Goldman et al., 2024). Putting these findings together, if we assume that the effects are real and causal, then the presence of third world migrants in the West is indirectly causing the native crime rate to be higher than what it would be if there was zero immigration by reducing the likelihood of natives getting married and thus no regulating effect on their behavior ever occurs.
Of course, there’s also other costs too. We know that because of discrimination in favor of blacks and browns relative to whites in hiring (Last, 2022), that within the same occupation, there is a racial gap in job performance whether measured through IQ (Murray, 2021) or through actually measuring job performance itself (Roth et al., 2003).


You could probably dig up the cost from the productivity loss in choosing to engage in this racially motivated anti-meritocratic hiring, but I’m too lazy to do it here.
If we’re talking about immigrants, then there’s the cost from displacing competing native workers. Isn’t the literature on immigration and wages highly debated? Yes, but high quality studies done with the correct methods such as accounting for the fact that native workers are living breathing human beings who relocate when their prospects get hurt generally find a negative effect of immigration on wages (see my post on it here). In the long run, one might also be concerned about the costs of the children of immigrant groups which are positively selected, as they will have regressed toward their means.
A stupid talking point by economists in favor of immigration is that “immigrants make the economy larger!” True, but the economy is a reflection of its factors of production. The question that we should be asking is who exactly are immigrants good for? In economics, while immigrants depress the wages of competing workers, firms benefit from being able to employ labor at cheaper costs, and some consumers gain from cheaper goods and services. The net gain from subtracting the winners’ gains and the losers’ losses is referred to as the “immigrant surplus”. In practice, this surplus is extremely small, just 2.2% of the increase in GDP, while the rest of the benefit goes to the immigrants themselves as wages and benefits (Borjas, 2013). If it isn’t obvious already, this small surplus covers up a massive bottom-up wealth redistribution from workers to employers, though with some benefit to consumers. Now, of course, this model is sensitive to the assumptions employed. Amior & Manning (2024) focused on the way monopsonies influenced the market dynamics of migrant and native workers. Since monopsonies have significant market power to influence wages, employers do not feel as much pressure to adjust wages quickly based on supply and demand. Under this model, both the wage reduction and the immigrant surplus would become larger than under the assumption of perfect competition. Aside from these two studies, the famous and highly cited 2017 report by the National Academies of Sciences, Engineering, and Medicine had estimated that the actual “benefit” of immigration to the native-born could be $54.2 billion a year. The authors don’t demonstrate how they got this number, but they provide all the information necessary to calculate it. In short, this “benefit” to the natives would come from reducing the wages of native workers who are in competition with immigrants by $439.4 billion annually, but the gain to businesses would be $548.1 billion, which would create a net “benefit” of $54.2 billion to natives. Whether or not most people would consider this a benefit, however, might be a slightly different story. Still, even this is probably overstating the ‘benefit’ of migrants, as it cannot account for the various indirect impacts that this large-scale bottom-up wealth redistribution has. For instance, natives whose prospects are hurt by migrants and leave their local area are also probably more likely to end up on welfare afterward, but the formula for calculating the immigrant surplus does not capture this, so in practice, the immigrant surplus is closer to $0 or even negative.
Is the Pie Fixed?
Advocates of immigration love to bring up the “fixed pie fallacy” as an immediate retort to dismiss any possibility that immigrants can hurt native prospects. In the most technical sense, the notion that the number of jobs in an economy isn’t fixed is true, but this is actually compatible with the claim that immigrants hurt native prospects. I won’t go super in-depth into this debate though since I’m writing this post barely awake after pulling an all-nighter, though what I will say is a good start.
We know that immigrant settlement patterns aren’t random but based on the local opportunities available (Kim & Sakamoto, 2013), meaning that these sorts of shocks to natives are occurring in relatively nice locations with high opportunity. Unsurprisingly then, in not just the United States but across countries with high levels of immigration, we can see that citizens are moving from areas of high productivity to areas of low productivity.

With this, we now have a potential mechanism for the displacement effect to persist, and in fact, there’s evidence that it does. Kim & Sakamoto had also analyzed the long-term effects of immigration on native wages in both two-digit and one-digit occupations from 1994 to 2006. The results from the occupation-level approach are presented on the right side, and we can see that the negative effect remained.

An excellent study which specifically looks at the effect of immigrants on native wages and accounts for the internal mobility of natives is Price et al. (2023). The authors explored what happened to native “movers” and “stayers” when immigrants moved in. After controlling for natives that were displaced as well as selective in-migration, the stayers did not see an income gain. Young workers were tracked for thirty years and were found to have suffered a persistent income loss that had not recovered, and among the ones that were displaced, their losses were twice as large as non-movers.2

And remember, in the modern context, natives are forced into areas that are worse than what they started off with in terms of opportunities, so we have no reason to expect that things got any better for them. Displacement aside, another interesting consideration is that of monopsonies and their ability to use immigrants to reduce the bargaining power of native workers, resulting in much slower wage adjustments than is traditionally assumed. Indeed, the Amior & Manning study considered this possibility, finding that “Based on our estimates, the expansion of native mark-downs (in response to migration) dominates the aggregate gains in marginal products. As a result, the average native wage declines, even in a “long run” setting with elastic capital. Though aggregate native income grows (due to the transfer of migrants’ rents), more than 100% of these gains go to profits, as the increased mark-downs redistribute income from workers to firms” (p. 39).
So while the pie might not be literally fixed, it certainly seems that it’s possible for the adjustment process to be slow enough to cause long-term pain for the natives affected.
What About Asians?
Demography blogger Arctotherium published an excellent piece showing that Asian Americans indirectly hurt the prospects of everyone else by exacerbating the negative externalities of the signaling model of education. Essentially, because most of the returns to higher education comes from the ability to signal desirable characteristics to employers (e.g., intelligence, conscientiousness, conformity, etc.) rather than actual skills acquisition, it is individually lucrative but collectively destructive as the choice to spend more years in education hurts equally qualified candidates in the labor market who choose not to engage in the signaling game. Asians, being the sheer academic strivers that they are, amplify this effect, as it forces the entire population of the country to do the same if they wish to distinguish themselves in the jobs market. This creates a destructive feedback mechanism of runaway signaling that forces everyone to spend ever more time in higher education in order to strengthen their signal to employers, wasting Americans time and money. This is a fantastic example of an indirect cost that is almost never discussed in debates surrounding policymaking despite it being extremely important when you point out the issue.
Beyond that, Asians are also less innovative than whites when controlling for nativity:


My own analysis of H-1B beneficiaries by country also confirms that China and India, the two largest shares of H-1Bs, have an underwhelming performance across several measures of innovation compared to Western migrants:

Lots can also be said about the political views of Asians. It’s no secret that they’re an extremely liberal group. After all, they are the racial group which is the least likely to feel pride in being American (Hawkins & Raghuram, 2020) and the most enthusiastic about the decline of the white majority in the United States (Krogstad et al., 2021).


Now, because they’re not exactly great at critical thinking, as their social conformity is likely an evolved psychological characteristic (see Dutton, 2020; Frost, 2023), they assimilate over time to the existing anti-white culture of the country. Asian Americans see themselves are being more similar to people of color than to white people, and being increasingly less likely to report feeling like they belong and are accepted in American society the younger they are (Lee, 2022).


You personally might say “okay, who cares, it’s just a different opinion”, but opinions translate into policy, and bad policy also carry heavy costs.
Suppose that you had a United States which was 50% white and 50% Asian. Let’s grant that Asians, on average, really did directly contribute more to the national coffer than whites did. But, also suppose that Asians are diehard lovers of immigrants and diversity, and so they vote to open the country up to the world. If immigration restrictions are relaxed, then the process becomes less selective, and consequently, the average skill level of immigrants decreases.

So now, because of these new arrivals, the country suffers a large economic burden. But clearly, it’s not just the new arrivals’ fault. After all, they could not have gotten here if they weren’t enabled to do so, and you would be correct to assign a portion of this fiscal burden onto Asians.
The point here is that the activities of races don’t simply exist in a vacuum, everything they do affects each other, both the good and the bad. Something like supporting diversity is just a code for anti-white politics, supporting bigger government is essentially helping to flush money down the toilet, and supporting prohibiting so-called “hate speech” helps to reinforce the former two. So where do Asians stand on these issues? Unfortunately, they are very keen on supporting all three of these:


As it just so happens, the fact that Asians are pro-immigration has been confirmed in an analysis by Noah Carl of Aporia Magazine today using the GSS.

Thus, the direct net effect estimate dramatically overstates the true positive economic contribution of Asians as it essentially ignores every single indirect cost associated with them. It’s already highly debatable if Asian Americans are a strength to the country, but what is certain is that they will become increasingly burdensome if more of them are imported over in ever greater numbers, which is in fact what is currently happening, as they are the fastest growing racial group in the United States (Budiman & Ruiz, 2021).
The Red Shift?
Some remain thoroughly unconvinced that the political views of non-whites will be a long-term problem for the country even if they agree that politics does have indirect economic costs attached to it. There are those who insist that the outcome of the 2024 election debunks the idea that it will be impossible to get minorities on board with sensible and pro-American politics. On its surface, the seeming “red shift” towards Republicans by non-whites during this election appears convincing, but when further scrutinized, the case falls apart.
The answer here lies upon the distinction between party and ideology. People naïvely assume that non-white Republicans are identical to white Republicans in their beliefs. This is false. Consider that black Republicans are far more likely to believe that discrimination against black people exists and is a major obstacle (Cox et al., 2022) than white Republicans do (Horowitz et al., 2019), or that Hispanic Republicans favor gun control and amnesty more than non-Hispanic Republicans (Krogstad, 2022).


Hispanic Republicans being more lax on immigration also defeats any already slim benefit to having them in the first place. People voluntarily choose which party to join, and we can expect new arrivals to probably not be Republicans, though even if they were, that matters less in reality than people think. Take an issue like wealth redistribution. There is no evidence that Hispanics have gotten any less supportive of it over time:

And let’s not forget that the 2024 survey from Pew Research Center cited earlier found that 70% of Hispanics believe that the government should do more to solve problems. The “red shift” in 2024 is not a real ideological change among non-whites to align with Republican values, but reflects the nature of the Republican Party gradually changing to appeal to the beliefs of non-whites. Sit back from modern politics and look to the country’s history. African Americans used to be net Republicans until 1936, what do you think happened afterwards? There was no radical ideological conversion of African Americans. Instead, they merely decided that Democrats were a better deal for them, and so they switched. Fast forward to today, and I don’t think anyone who isn’t intellectually dishonest would disagree that Democrats cater to the interests of black people.
And what about Asians? Does the discrepancy between identifying as Republican and actually supporting sane policies also apply to them? Of course it does. In the 2022 Asian American voter survey, among Asian Republicans, 35% support shifting spending from law enforcement to programs for minorities, 60% favor more gun control, 42% support a pathway to citizenship for illegal migrants, and 56% support affirmative action.
How did naturalized immigrants vote? There’s no data on this, but our good friends at the Cato Institute would like you to believe that naturalized immigrants actually voted net Republican (Nowrasteh & Chanwong, 2025). Now, aside from the fact that the party labels don’t matter as much for non-whites, you might think that there’s no way this can be right. Indeed, this is a sketchy result. They don’t actually show the voting pattern of naturalized immigrants, but rather, they merely infer that they probably voted Republican because a greater share of their presence is positively correlated with Trump votes. However, I suspect their conclusion, that this is likely due to naturalized immigrants voting Republican, is wrong. Why? Well, we know that actual racial contact (and this is the correct way of measuring the effect on attitudes, and not those dumb studies they cited on policy reform in that post. You don’t really hate ’em ’til you really know ’em) not only does not reduce prejudice (Dinesen & Sønderskov, 2015; Leeuwen et al., 2023; Paluck et al., 2019), and that, in the case of blacks (Vuletich et al., 2023) and Hispanics, contact probably increases prejudice (Enos, 2014). Now, I couldn’t find a good study on the effect of exposure to Asians, but we do have evidence that Asians also cause white flight (Boustan et al., 2023), so assuming that exposure to all racial groups increases negative attitudes among whites, what’s likely going on is that whites in areas with a larger immigrant share probably voted more Republican than whites in areas with a smaller immigrant share.
So, what’s the lesson here kids? Racial diversity might not in fact be our greatest strength, if it ever was a strength at all.
Sources Used for Calculations
U.S. government revenue in 2022: Government Revenue Details for 2022
U.S. government spending in 2022: Government Spending Details for 2022
Tax Payment by Bracket: Who Pays Taxes in America in 2020 and Who Pays Taxes in America in 2024
Medicare Usage by Race: Distribution of Medicare Beneficiaries by Race/Ethnicity
Medicaid Usage by Race: Distribution of the Medicaid Population by Race/Ethnicity
Social Security by Race in 2022: The World Almanac and Book of Facts 2024
Law Courts, Police, and Prisons Usage by Race: Prisoners in 2022 – Statistical Tables
Data on welfare usage was personally requested from the Center for Immigration Studies
Public Transit Usage by Race: Who Rides Public Transportation
Racial Composition in the U.S.: Hispanic or Latino Origin by Race